Many customers have been providing feedback to help us improve the design of our status pages.
Today we’re announcing a few design enhancements that have been rolled out so far.
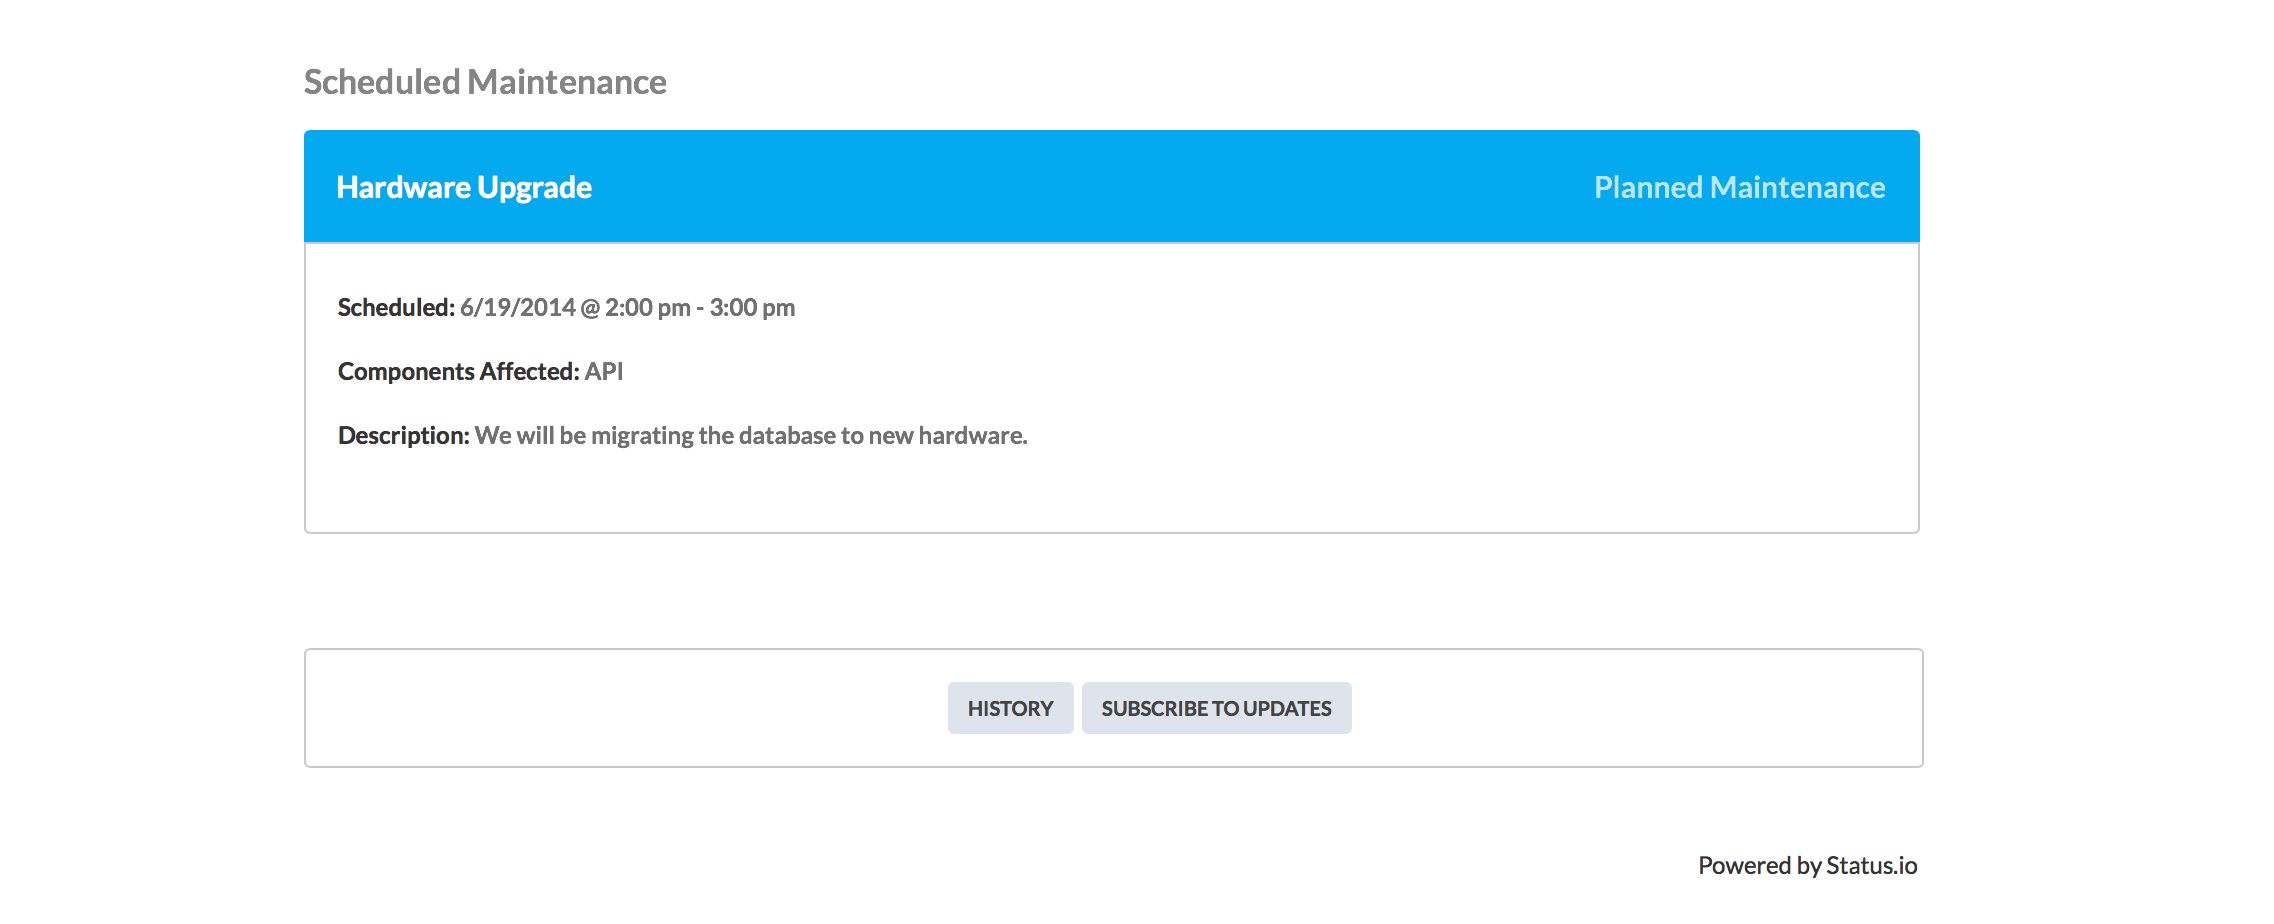
Scheduled Maintenance
Upcoming maintenance activities are now displayed directly on the main status page. This eliminates the need for a separate dedicated maintenance page.
Hidden Containers
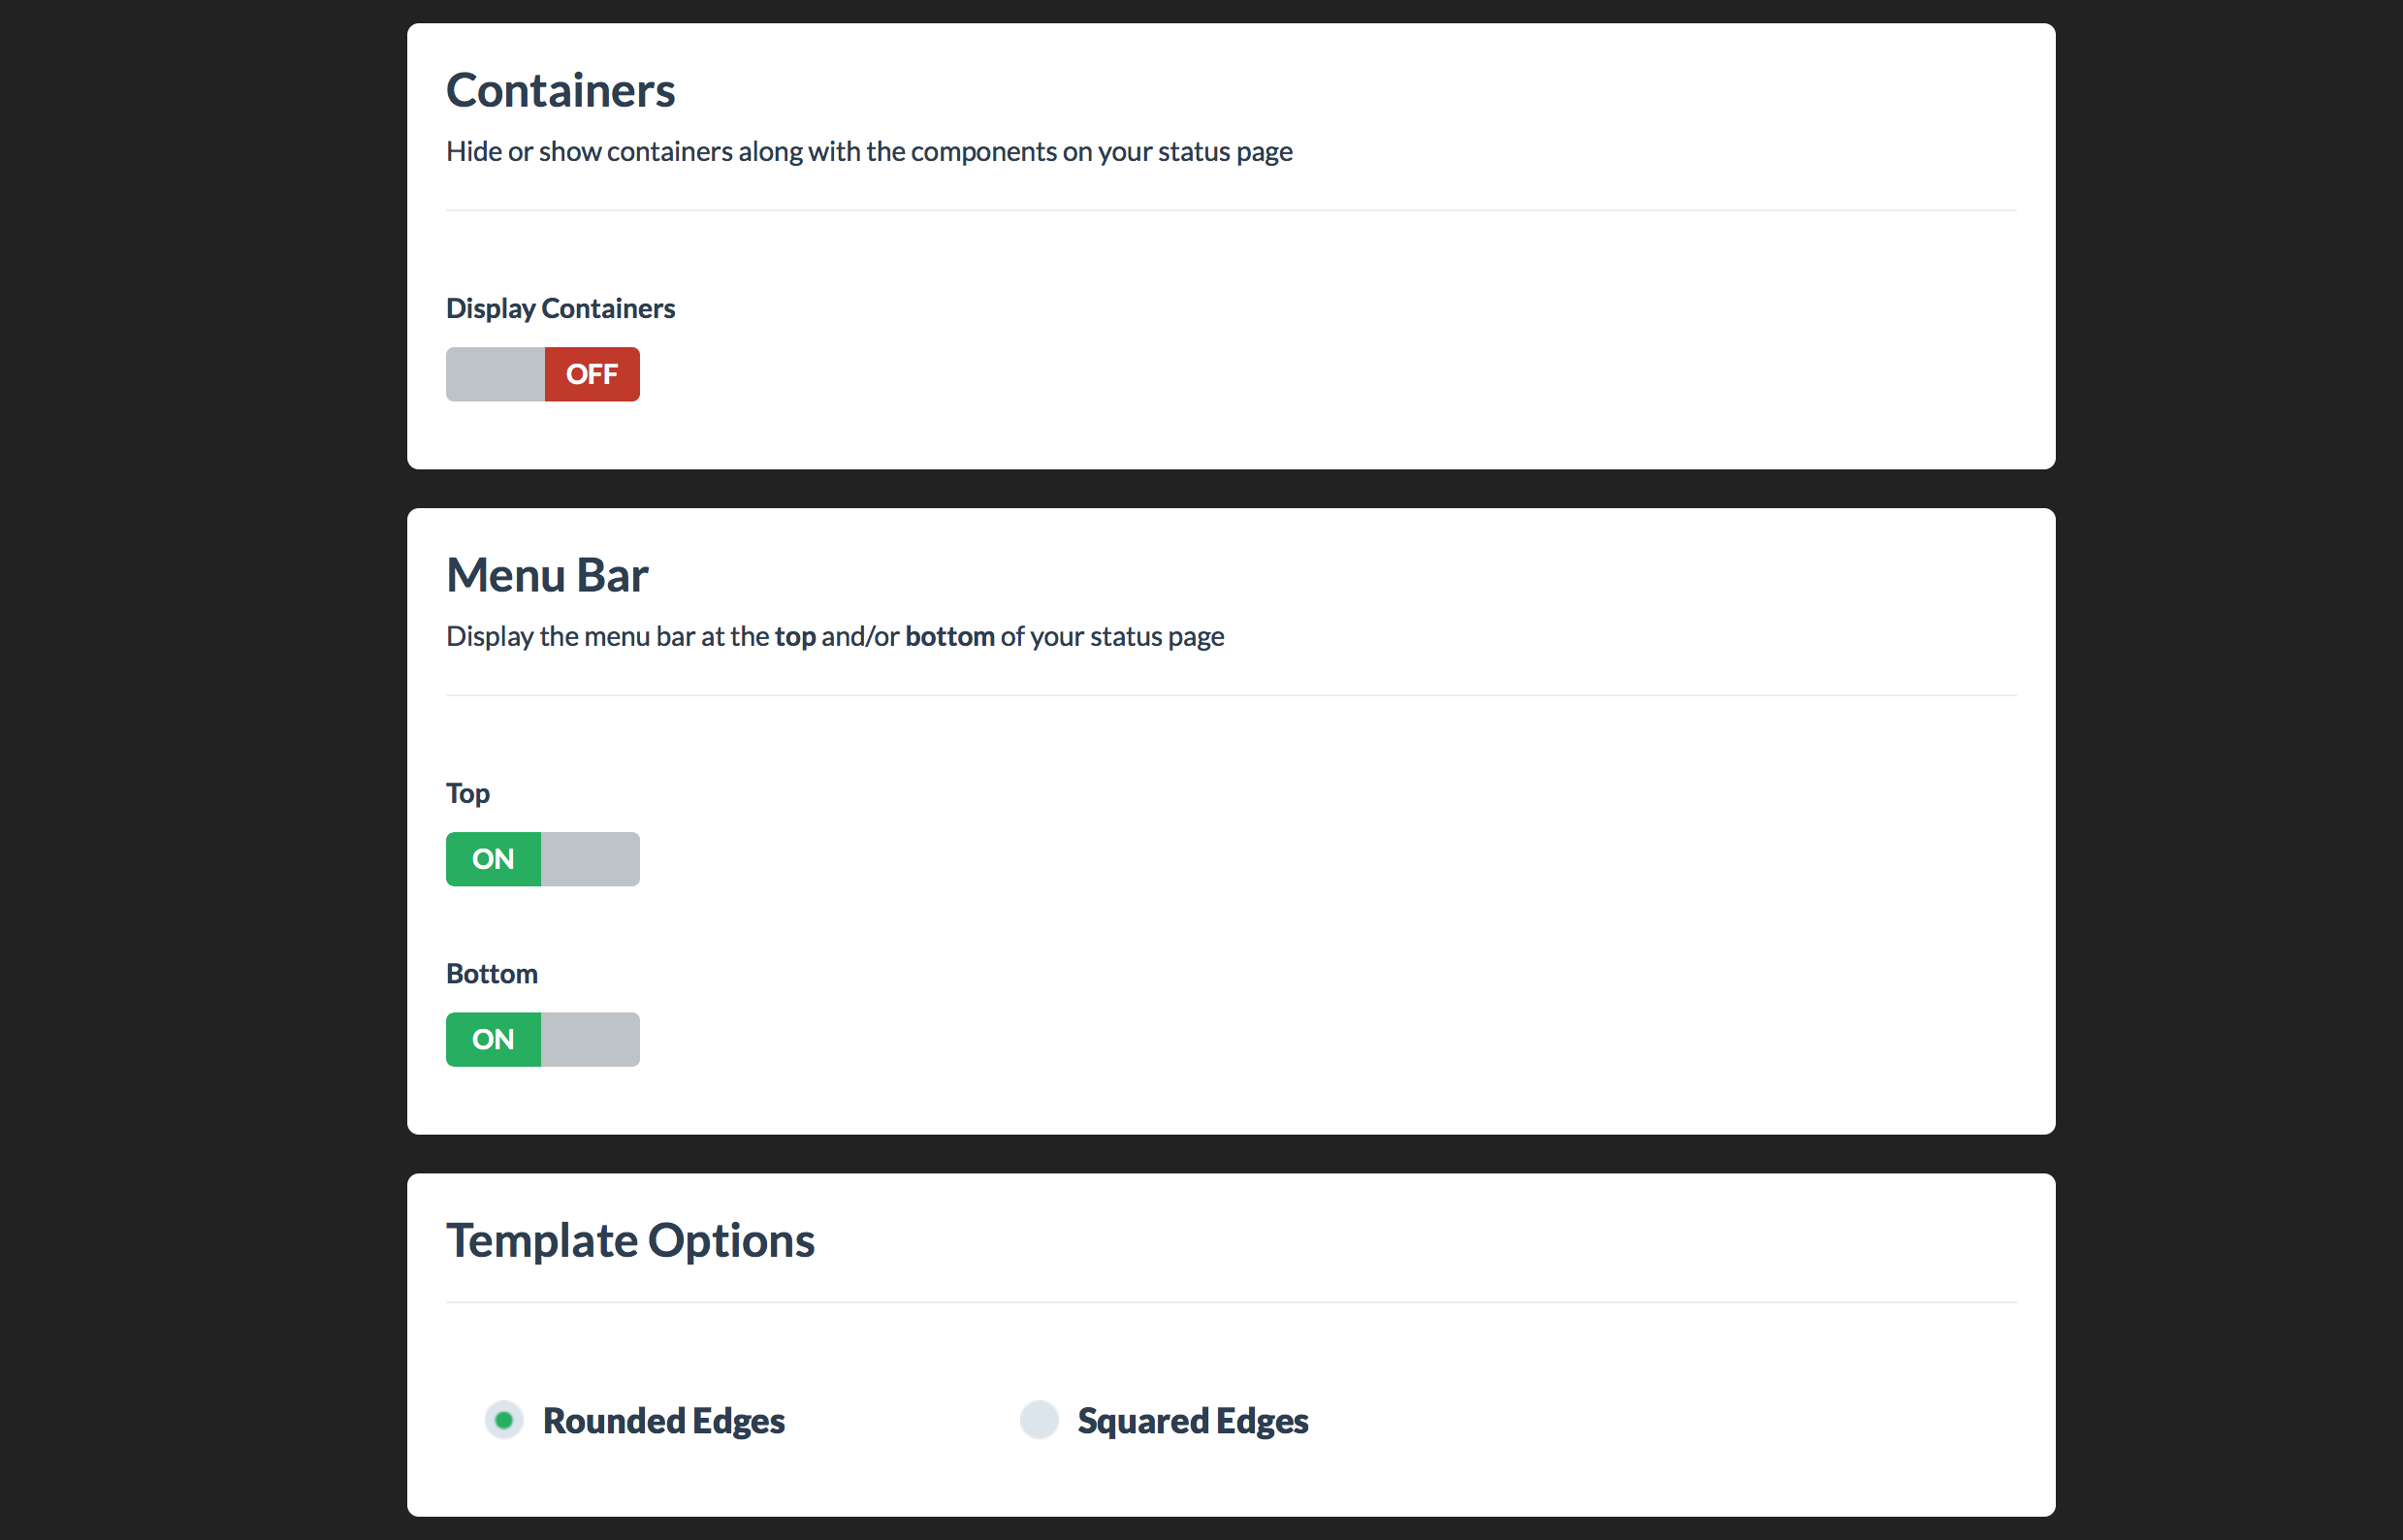
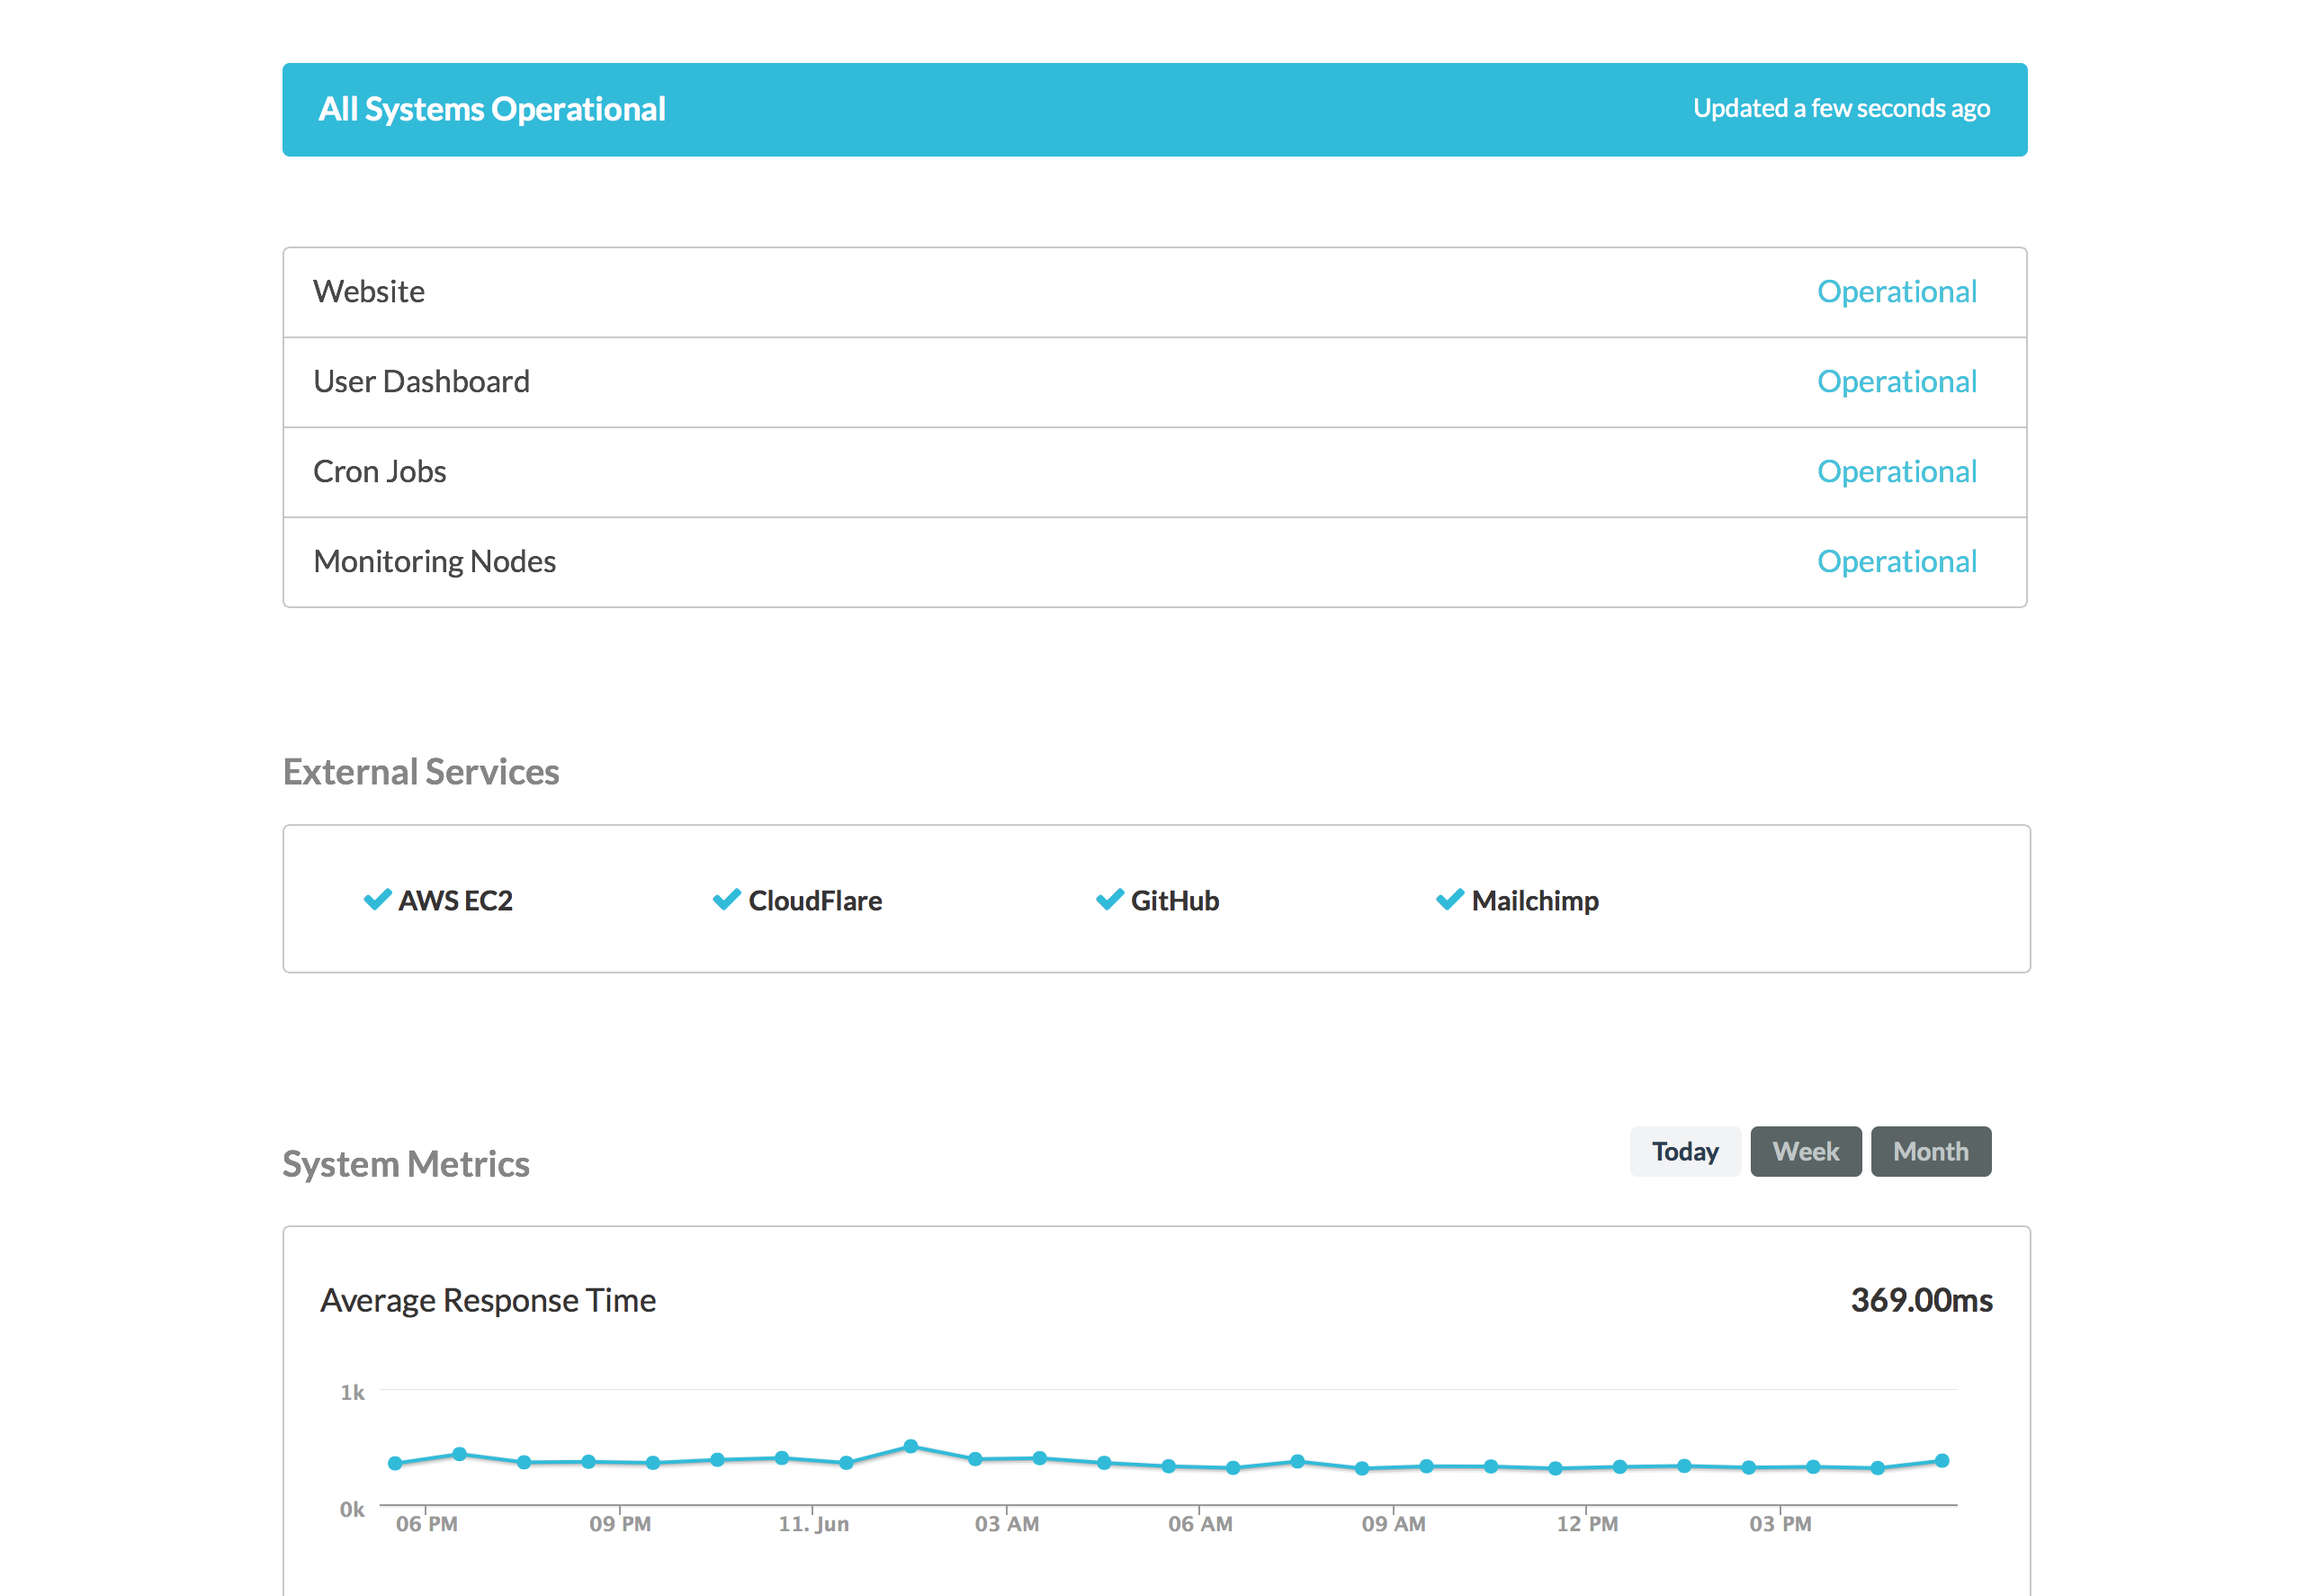
Containers are the best way to show the status of a component in a specific location. However, containers are not suitable for every status page. Now you may choose to display the containers or not.
Here’s a nice example of a status page with the containers hidden:
Border Edge Options
We started with the simple old school squared edges in our flat design. Today we unveil the Rounded option. While this is a simple toggle setting, it drastically alters the look and feel of your status page.
New pages will have rounded edges by default. Current status pages can be switched to the rounded edges by toggling the option in the Design view.