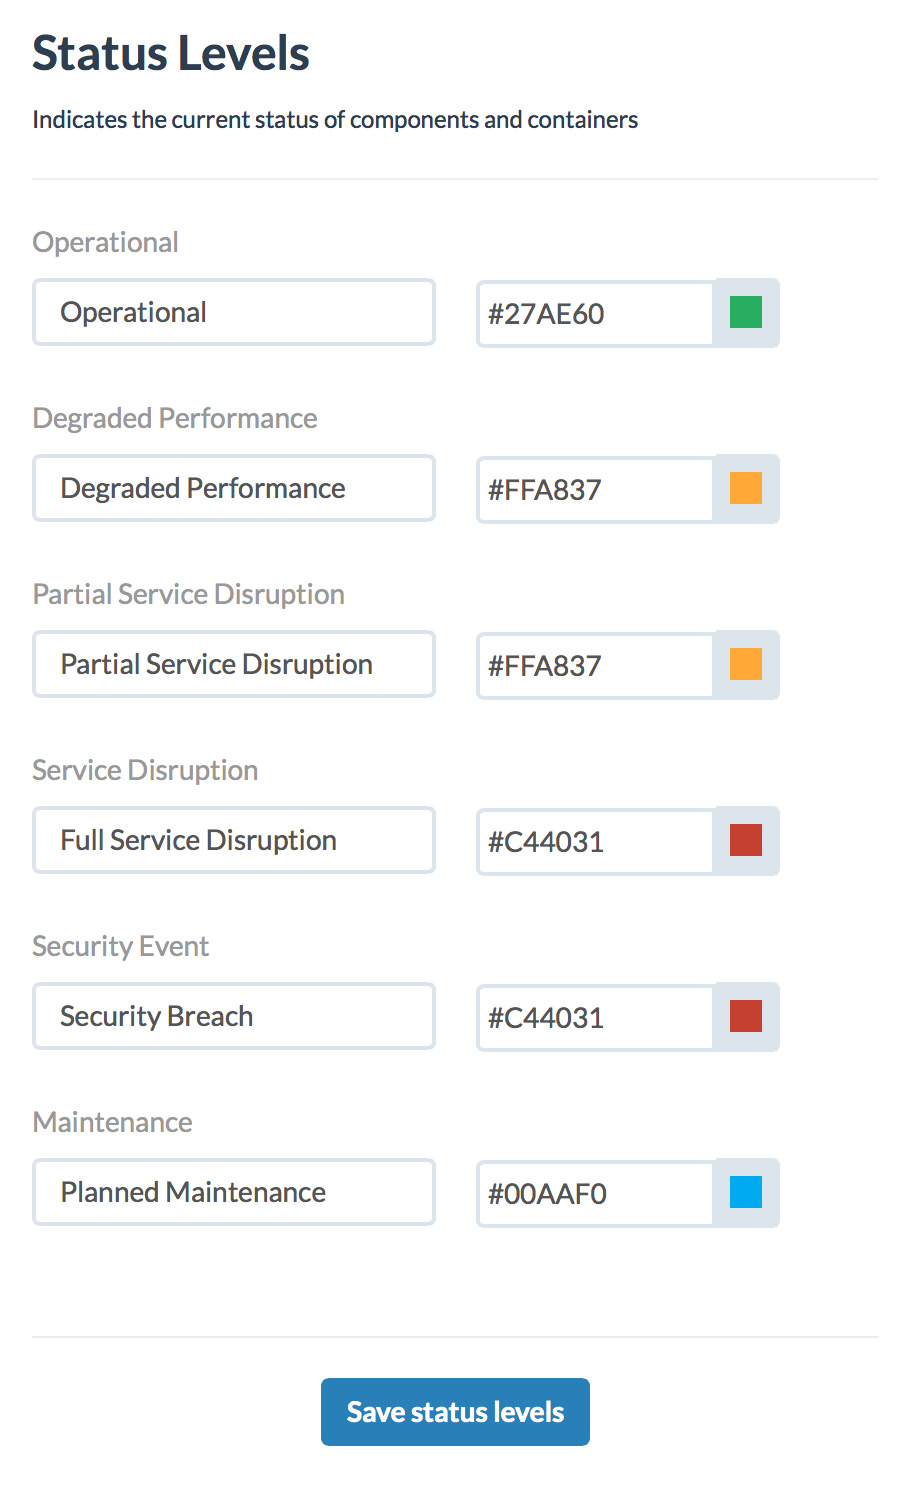
Status level colors are used to visually indicate the current status of a specific component, container or incident.
Example: The table of components at the top of the status page are each colored according to the current status.
Here’s what each color means:
Green — OK / Operational
Blue — Maintenance
Orange — Warning / Partial outage / Degraded performance
Red — Emergency / Major outage / Security issue
Up until now, every status page used the same shade of each color.
Starting today you may choose your own colors. Use the Dashboard Design view to pick your colors.
